Outliers and Central Tendencies
Chong Ho Yu, Ph.D., D. Phil.
This objective of this
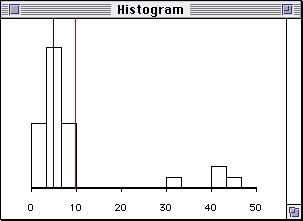
program is to illustrate the relationship between outliers
and central tendencies--mean, medium, and mode. It is a popular belief
that at the presence of outliers the mean skews towards the outliers,
the mode is most robust and the medium is between the previous two.
Actually in many cases even there are quite a few outliers and the
outliers are very extreme, the medium and mode are still in the same
location.

This program is very easy to use. A pre-defined
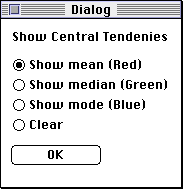
dataset is plotted when the program is loaded. You can show the mean,
medium, and mode by selecting one of the radio buttons and click OK. I
intend not to show all three at the same time because in most cases the
mode and the medium are overlapped and therefore they must be shown one
by one.

You can use the pull down menu to add outliers
or
reset the dataset to the original.

Return to front page
|