Multi-collineartity,
Variance Inflation
and Orthogonalization in Regression
|
Chong Ho (Alex) Yu, Ph.D., D. Phil. (2022)
|
Introduction
The purpose of a regression model is to find out
to what extent the outcome (dependent variable) can be predicted by the
independent variables. The strength of the prediction is indicated by R2,
also known as variance
explained or strength of determination.
It is important to notice that the value of R2
alone cannot tell you how well your model is specified.
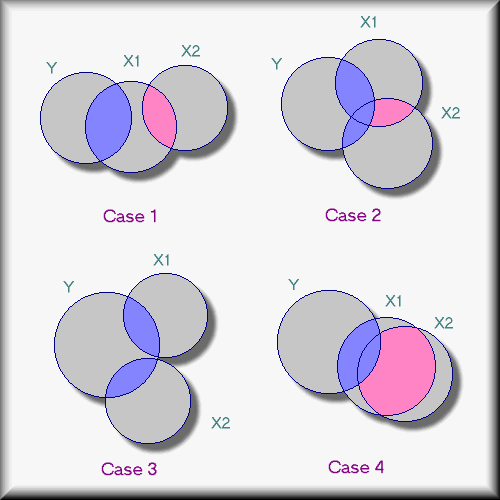
Take the following four cases as examples. In the Venn diagrams below
the overlapping area between Y and X(X1, X2)
is the variance explained. In all four cases the superimposed areas
between Y and X
are almost the same. Numerically you cannot tell much difference when
the R2s are .45, .48, .41, .40.
Actually, all these models are very different.
<
- In case 1, X1 and X2
are related; X1 and Y are related, but X2
and Y has no relationship.
For example, the number of hours of study is related to test scores,
the frequency of
going to the restroom is related to study (you drink more coffee to
stay up), but going to the bathroom
is not related to the test performance.
- In case 2, both X1 and X2
contribute to some unique variance explained to Y, but they also have
some common variance explained. For example, drinking and smoking can
cause cancer. And many smokers are also alcoholics.
- In case 3, again both X1 and
X2 contribute unique variance explained to Y,
but X1 and X2 are totally
unrelated (orthogonal). For instance, mathematical intelligence and
verbal intelligence could predict competence in business, but these two
types of intelligence have no relationship. A good speaker may not be
able to count from one to ten.
- In case 4, although both X1
and X2 could predict Y. The variance explained
contributed by X2 has been covered by X1
because X1 and X2 are too
correlated (collinear).
The above cases are not exhaustive. There are many
other possible combinations between Y and Xs. Without looking at the
relationship between regressors, the researcher runs a risk of
mis-specify a regression model even though the R2
looks good. This tutorial is focused on the last case--
collinearity.
Navigation
Index
Simplified Navigation
Table of Contents
Search Engine
Contact
|