The objective of this write-up is to introduce a quick and dirty
way to create various statistical charts without struggling with the way of
entering data.
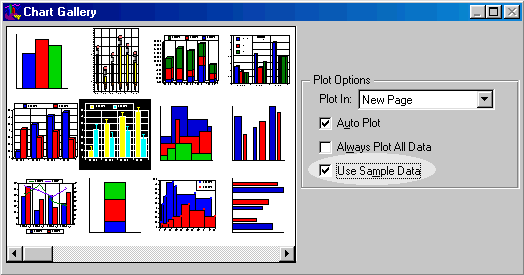
DeltaGraph is a product of SPSS Inc. It is a charting software for summary
data rather than for raw data. The software carries a very impressive library
of various statistical chart. The easiest way to use them properly is to select
a chart type first, and then plot it with the sample data.
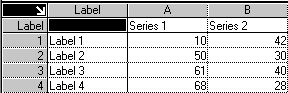
After a chart has been plotted with the sample data, return to the spreadsheet
using the pull down menu View/Data View. In the spreadsheet you can
edit the label and the data, save the file, and then plot the same type of
chart with your own data.