Centered-score Regression
When your regression model involves an interaction term, it is advisable to use a centered score regression model.
It is because this transformation can yield a proper interpretation of the data, and also make the scales of the dependent and independent variables comparable.
A centered score is also known as a deviation score, which is (raw score - the mean).
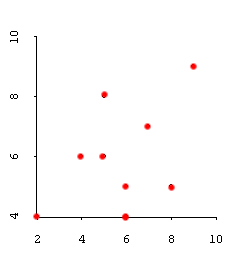
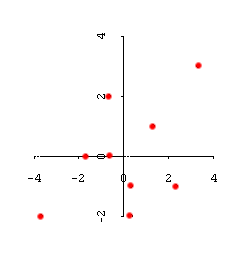
The following left panel shows a scatterplot of raw scores and the right panel shows a scattergram of centered scores.
As you notice, after the transformation the data point pattern remains unchanged, but the mean is 0, which is the center
of the plot. In a two-variable case, the data pattern can be visually detected by looking at the deviation from the center
and the distribution around the center.


One of the reasons to center data is to yield a proper interpretation of a regression model that involves a high-order interaction effect (Aiken & West, 1991). Consider the following uncentered regression model:
Y = b0 + b1X + b2Z + b3XZ + e
whereas:
- b0 = the intercept when X = 0 and Z = 0
- b1 = the coefficient of X when Z = 0
- b2 = the coefficient of Z when X = 0
- b3 = the coefficient of the interaction effect, XZ
The interpretation of the interaction effect, XZ, is fine in this uncentered regression model. But problems arise in the lower-order variables, X and Z, when the coefficients could be interpreted properly if and only if X=0 or Z =0. Nevertheless, a centered-score regression does not have this problem because the means of all centered scores are zero.
In addition, a multiple-variable case such as a multiple regression, centered scores can help to rescale mis-matching scales.
For example, assume that you have two predictors, X1 and X2, one interaction effect, X3 (X1 * X2), and one outcome variable, Y. And all of their values are based upon a 5-point Likert scale. In this case, the range of X3 is from 1 to 25 whereas Y's is only from 1 to 5, as shown in the following example:
| Y | X1 | X2 |
X3 |
| 5 | 3 | 5 |
3 * 5 = 15 |
| 2 | 3 | 1 |
3 * 1 = 3 |
| 3 | 5 | 5 |
5 * 5 = 25 |
| 1 | 1 | 4 |
1 * 4 = 4 |
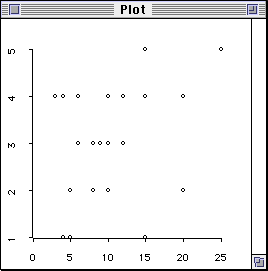
If you plot the data, the mismatch of scales is very obvious. The observations are located in the five implied lines from the five values of Y. If you force a regression line through the data points, the residuals will be very high (see the following figure). Once a doctoral student consulted me about his dissertation. I found that the scales of the predictor and the outcome didn't match. Despite that I showed the problem graphically, he insisted on his regression analysis because his committee wanted him to do so.

This problem can be easily overcome by a centered-score regression. By centering the scores (raw scores - mean), the scale of the interaction term shrinks from 1-25 to 0-7.5, as shown in the following table:
| Y | X1 | X2 |
X3 |
| 5 | 0 | 1.25 |
0 * 1.25 = 0 |
| 2 | 0 | -2.75 |
0 * -2.75 = 0 |
| 3 | 2 | 3.75 |
2 * 3.75 = 7.5 |
| 1 | -2 | 0.25 |
-2 * 0.25 = -.05 |
The SAS code for centering scores is illustrated in the following.
DATA ONE;
INPUT Y X1 X2;
....
PROC MEANS; VAR X1 X2;
OUTPUT OUT=NEW MEAN=MEAN1-MEAN2;
DATA CENTER; IF _N_ = 1 THEN SET NEW; SET ONE;
C_X1 =(X1 - MEAN1);
C_X2 =(X2 - MEAN2);
C_X1X2 = C_X1 * C_X2;
PROC GLM; MODEL Y = C_X1 C_X2 C_X1X2;
Centering scores is still a debatable procedure. Katrichis (1992) argued that this technique produces systematically biased estimates of main effects.
Indeed, this procedure may also bias against the interaction term. For example, in the previous example when one of the main effect has a zero value, the interaction term would also be zero regardless of what the other main effect value is ( see the first two observations: 0 * 1.25 = 0; 0 * -2.75 = 0).
Kromrey and Foster-Johnson (1998) also doubt about the worth of this procedure. They asserted that the result of centered and non-centered regression models are almost identical.
References
Aiken, L. S., & West, S. G. (1991). Multiple regression: Testing and interpreting interactions. Newbury Park, CA: Sage Publications.
Kromrey, J. D. & Foster-Johnson, L. (1998). Mean centering in moderated multiple regression: Much ado about nothing. Educational and Psychological Measurement, 58, 42-68.
Katrichis, J. (1992). The conceptual implications of data centering in interactive regression models. Journal of Market Research Society, 35, 183-192.

|
This statistician has done
too much multiple regression.
|
Navigation
Index
Simplified Navigation
Table of Contents
Search Engine
Contact
|


