One-Stop Internet Resources for Statistical Education
Yu, Chong Ho and John T. Behrens, Arizona State University
John T. Behrens, 325 Payne Hall, ASU, Tempe AZ 85287-0611
Paper presented at the 1995 Joint Statistical Meeting of the American Statistical Association (Statistical Education Section) Orlando, FL
Contents
About our Web Site
How to get there
Perhaps the most important thing to know about our work is its location on the internet. Our resources are based on the WWW format in the internet that can be accessed with browsers such as NCSA Mosaic, the Netscape browser or the new Microsoft browser that comes with Windows `95. The location of our web site is:
At present our site is organized into four major areas: ASU related resources, Teaching Resources, a section entitled "Learning More" and the Educational Statisticians home page from the American Educational Research Association. The ASU section includes some course syllabi, descriptions of our faculty and some papers and simulations relevant to our students. The teaching resources section contains just what its name indicates and will be discussed in detail below. The learning more section contains resources for learning more about statistics and data analysis. The AERA statisticians section provides newsletters and information for that group.
Design Principles
The appearance of web pages varies remarkably across web sites. We have constructed the pointers on site with four major principles. First when we point you somewhere, we should tell you something about where your computer is going to be pointed. There is no sense clicking on a link to a computer you don't want to go to. If we don't tell you about the site, then you will have to waste your time figuring out if you want to go there or not by actually doing it first. Second, we give both high level and low level links when possible. A high level link puts you at the index to resources on the web. Low level links point you to specific files. By providing links to both you can both search through other computers (using the high level links) or avoid your own searching and go right to specific resources (using low level links). Third, we try to help you navigate our own pages by marking all of our pages with links to the different areas of our system. This way, if someone else's pointer send you to our computer, you know where you are and who is responsible for what you see. The last principle is that we tell you where you are going. When you click on a hyper-link you may be going to another part of our system, or you may be going to see data from a computer on the other side of the world. We know how hard other people have worked and so we make sure the links are properly labeled to reflect the fact you are going to be in someone else's data -- so you don't attribute their work to us. The failure to acknowledge the origin of resources on the web is disappointing and we hope not to be part of the problem.Resources for teaching statistics
When we started this project well over a year ago, we were interested in collecting real data for use in classes. At that time our work focused on finding on-line datasets in so-called gopher-space. This is a relatively crude part of the internet without a graphical interface in which the user is essentially searching through directories and files with little information. Since that time the WWW has provided an exciting, easily usable graphical interface for moving among and within computers, for providing vivid on line documents, and for constructing interactive programs on the web. Clearly, the biggest limitation in our use of the Web is our imagination and our previous experience.For example, we recently taught an introductory class to education graduate students who had never had statistics before. The goal of the first day was to show relevance of the course and convince them of their ability to survive and thrive. The class outline for the day was projected from a computer screen. The syllabus was written in Hyper Text Markup Language (HTML) the language of the WWW. The outline of the class was presented on the screen (off of the internet) and when different lines of the outline were clicked on, the appropriate document was shown. After going over the syllabus we looked at some charts in the Census Bureau computers showing the median salary of individuals by education attained and gender. The students were quick to realize the females made less. They were quickly drawn into an appreciation for data analysis by seeing how data could reveal information about the real world.
There are many creative ways that instructors can enhance statistical education by using WWW in class. For example,. a) downloading authentic datasets for data analysis exercises, b) solving problems in an interactive manner, and c) showing on-line graphs and animation to illustrate abstract concepts.
Dr. B's Wide World of Web Data.
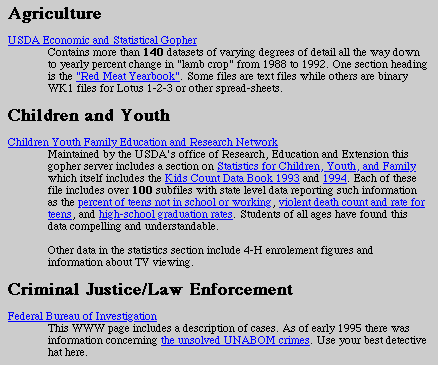
As we noted above, our work on the internet began with the search for example data for classes. While there are a number of archives of example data from the statistical community, we have been primarily interested in helping students and faculty access real on-line datasets that are of interest to them. To facilitate this we constructed Dr. B's Wide World of Web Data as shown in Figure 1.Dr. B's Wide World of Web Data is a set of links and descriptions of data in thousands of datasets from throughout the world. It is organized by topic areas such as agriculture, children and youth, language and literature, medicine and health, political studies, food, government, history, economics, education, environment, criminal justice/law enforcement, demographics, drug use, sports, and social sciences in general. For example, the Kid Count Data Book is published annually with state-level data describing drug use, unemployment, births, drop out rates, etc. Our students find these data particularly interesting. We use these data to construct the plots we use in our own classes (e.g. %violent crimes by teens vs. %poverty level in each state). In our undergraduate class the mid-term project consist of collecting or finding data, asking questions about it, and writing a report. Though not restricted to internet data, the students find the easily accessible internet resource quite exciting and interesting.
Consistent with the design principles described above, the data are accompanied by short descriptions of the data and the site. This eliminates the need for the user to check the site and wade through countless subdirectories. We have put many hundred hours into this project and offer our experience in the searching and examining the datasets to the public. In addition to our brief comments, links to upper level directories are also available for those who like to look everywhere.
Figure 1. Dr. B's Wide World of Web Data
Other sources for real data
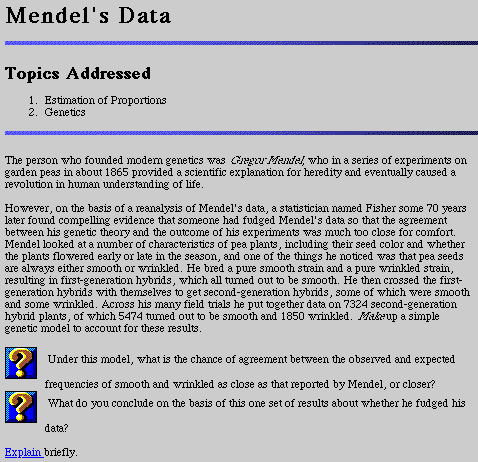
In addition to Dr. B's Wide World of Web Data, our site provides links to other sites providing data archives including StatLib at Carnegie Mellon, and the UCLA stats server (see Figure 2). The UCLA stats server is particularly interesting because it provides a number of excellent case studies of data analysis including background information, raw data, programs to analyze the data, and discussions of the results. This has the advantage that is they are well packaged and well suited for making a particular point. On the other hand they represent a somewhat cleaned up version of the world and have already gone through the interpretive processes of the creators. Accordingly, we like to balance use of the case studies with use of the Wide World of Web data in which students are forced to construct their own questions and see the messiness of the data before it gets to the data analyst.Figure 2. Example of a case study from the UCLA Stats Server
Sources for On-line instruction
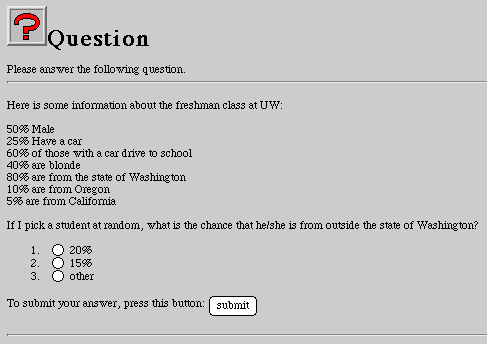
As the WWW matures, interactive materials for learning statistics on the internet are emerging. While none of these projects are complete, they offer a good look at where things are going in the future, and can be helpful to students in their current state. Our site has links to two on-line statistics text-books and an interactive diagnostic tool for rooting out misconceptions in probabilistic reasoning. The latter tool, called the Diagnostic Instructional Aid for Noetic Advancement (DIANA) asks questions to which the user responds. Question are simple multiple-choice questions about the correct answer to a probability problem, as well as questions about the reasoning employed by the student. Users receive feedback based on these answers. The DIANA system is employ's the WWW's ability to process information from forms as seen below.Figure 3. Diagnostic Instructional Aid for Noetic Advancement
Dynamic Graphics and animations
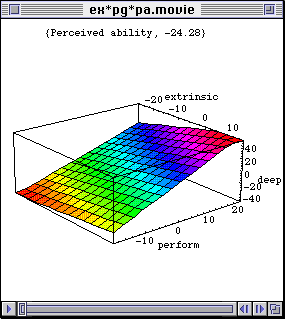
Dynamic graphics and animations present another layer of interactivity available over the internet. For example, the UCLA Statistics Department server includes dynamic graphics in XLISP as part of their on-line course work. When working from a UNIX terminal, users can run the WWW Browser and the XLISP interface simultaneously to work smoothly in both environments. At ASU, few of our students or faculty work in XLISP on UNIX machines. Instead, we locate our XLISP files directly on the machines with WWW documents instructing the user to switch to the XLISP window and chose the appropriate demonstration. In addition, to augment these simulations, we are in the process of recording the image computer screen as it appears when running these simulations into the QuickTime format. Later, when the student wants to see what was done earlier in class, or is not sure how to access the LISP program, a brief movie can be played of this activity by simply clicking on the WWW page.In addition to dynamic graphics that can be manipulated in the XLISP environment, we are also developing QuickTime movies of statistical concepts such as the third order interaction shown below. While a second order regression interaction is relatively straight forward to illustrate using a curved surface, in the third order interaction the surface changes over the third variable. We construct a movie of the third order interaction by computing the 2nd order surface at each level of the third independent variable and stringing the images together, the student In the QuickTime format the student can stop the movie at any value of the third variable, and replay the images at will. For example, the following figure is a mesh surface illustrating 3-way interaction in a regression model made in Mathematica and saved as QuickTime format. These technologies work well because the language of the WWW allows an individual's computer to automatically download and play the movie if the appropriate movie viewing software is installed. This is not a problem since there are free QuickTime viewers available on the WWW for Mac, Windows and UNIX systems. Because of the diversity of data types and viewers, we provide links to the most commonly used movie viewers and converters.
Figure 4. QT Movie showing a 3-way Interaction in regression
Learning about Statistics Education
In addition, to these items, there are numerous WWW-based resources that instructors can use when preparing their course materials including browsing such on-line references as the Journal of Statistics Education, the newsletter of the International Study Group for the Psychology of Probability and Statistics, and information by and about the International Association for Statistics education (IASE).Papers, Reports, FAQs, and Software
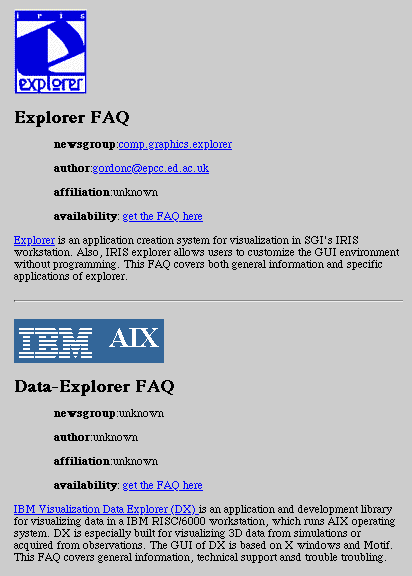
In addition to the materials aimed explicitly at teaching statistics, we hope to support those who want to learn more about statistics in a section entitled "Learning More". In addition, some of our own work is presented in the ASU section. These our reports are available on line so they can be accessed by students looking to learn more than may be addressed in a course, or by other faculty (see Figure 5). These papers are presented in HTML format with links to related documents and to different parts of a paper. The HTML is a converted version of a word processed text with most of the appropriate styles and fonts. Using HTML allows the imbedding of graphics and movies that illustrate the concepts discussed. Papers are also provided in Rich Text Format (RTF) of those reports, because RTF can show exactly what the original styles, fonts, and graphics looked like. If you are a Mac user, the browser can trigger Microsoft Word to open the RTF document. Even if you do not have Microsoft Word, Microsoft Cooperation will soon provide a Word viewer as a freeware.In addition to providing papers of particular interest to our own work, we also complied a list of FAQs regarding to scientific visualization (Figure 6). An FAQ is a response to Frequently Asked Questions for a particular newsgroup. Again, we add a brief description to each FAQ in order to save users' time in browsing. The list of FAQs is divided into four categories: a) general FAQs on graphing, b) FAQs by platforms, c) FAQs by software, and d) Miscellaneous FAQs. The email address of the author and the UseNet discussion group associated with the FAQ are hot-linked. However, the direct access to UseNet groups is not available in several Web browsers. These resources are, of course, not unrelated to teaching statistics and are often used in our classes.
Figure 5. Papers and reports from ASU faculty and students
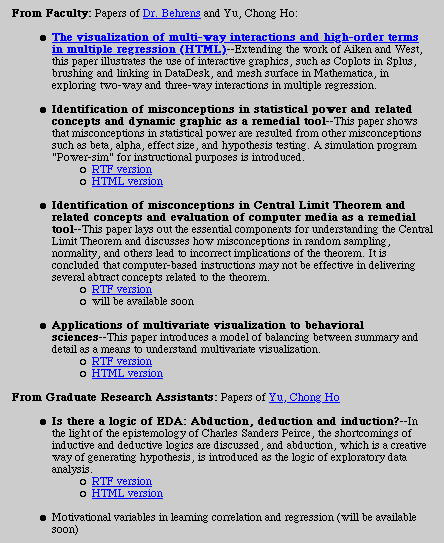
Figure 6. FAQs
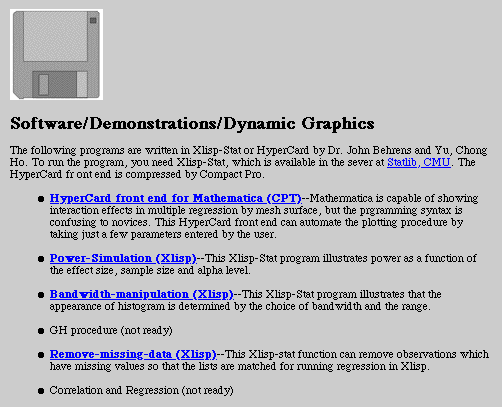
Software. Currently, we are collecting addresses of statistical shareware sites. Soon we will set pointers to those locations. In our server we post several programs written by us for data analysis or statistical instruction, as shown in Figure 7.
Figure 7. Software written by ASU Faculty and Students
Conclusion
World Wide Web is a helpful resource for enhancing statistical education. While we are unlikely to provide a one-stop shopping site for all statistics instruction tools on the internet, this vision drives our work. We are currently involved in taking WWW resources (such as on-line data) and making them more useful to the teacher in the field. For example we are taking a number of datasets from the Kids Count Data sets and plotting the bivariate scatterplots so examples of different patterns can be seen easily and used for instruction. Other projects include expanding our database of QuickTime movies of simulations, expanding our set of XLISP simulations, and updating the Wide World of Web Data. If you have a favorite link you would like to share, or have a resource you would like linked, please let us know.
Navigation
Simplified Navigation

Press this icon to contact Dr. Yu via various channels