Reliability of self-report data
Revised: February 28, 2023
Do the subjects tell the truth?
 The
reliability of self-report data is an Achilles’ heel of
survey research. For example, opinion polls indicated that more than 40
percent of Americans attend church every week. However, by examining
church attendance records, Hadaway and Marlar (2005) concluded that the
actual attendance was fewer than 22 percent. In his seminal work
“Everybody lies,” Seth Stephens-Davidowitz (2017) found ample evidence
to show that most people do not do what they say and do not say what
they do. For example, in response to polls most voters declared that
the ethnicity of the candidate is unimportant. However, by checking
search terms in Google Sephens-Davidowitz found the otherwise.
Specifically, when Google users entered the word “Obama,” they always
associated his name with some words related to race. The
reliability of self-report data is an Achilles’ heel of
survey research. For example, opinion polls indicated that more than 40
percent of Americans attend church every week. However, by examining
church attendance records, Hadaway and Marlar (2005) concluded that the
actual attendance was fewer than 22 percent. In his seminal work
“Everybody lies,” Seth Stephens-Davidowitz (2017) found ample evidence
to show that most people do not do what they say and do not say what
they do. For example, in response to polls most voters declared that
the ethnicity of the candidate is unimportant. However, by checking
search terms in Google Sephens-Davidowitz found the otherwise.
Specifically, when Google users entered the word “Obama,” they always
associated his name with some words related to race.
For research on Web-based instruction, web usage data may be obtained
by parsing the user access log, setting cookies, or uploading the
cache. However, these options may have limited applicability. For
example, the user access log cannot track users who follow links to
other websites. Further, cookie or cache approaches may raise privacy
issues. In these situations, self-reported data collected by surveys
are used. This gives rise to the question: How accurate are
self-reported data? Cook and Campbell (1979) have pointed out that
subjects (a) tend to report what they believe the researcher expects to
see, or (b) report what reflects positively on their own abilities,
knowledge, beliefs, or opinions. Another concern about such data
centers on whether subjects are able to accurately recall past
behaviors. Psychologists have warned that the human memory is fallible
(Loftus, 2016; Schacter, 1999). Sometimes people "remember" events that
never
happened. Thus the reliability of self-reported data is tenuous.
Although statistical software packages are capable of
calculating
numbers up to 16-32 decimals, this precision is meaningless if the data
cannot be accurate at even the integer level. Quite a few scholars had
warned researchers how measurement error could cripple statistical
analysis (Blalock, 1974) and suggested that good research practice
requires the examination of the quality of the data collected (Fetter,
Stowe, & Owings, 1984).
Fradulent responses from online participants
Availability of online panels for collecting self-report
data is both a blessing and challenge to researchers. On the one hand,
online recruitments provide a fast and affordable way to research a
wide spectrum of participants. On the other hand, without careful
screening online participants recruited by MTurk, Cloud Research, and
Qualtrics might cause a drastic drop in data quality when those
participants could hide their true identities behind the Internet. For
example, being driven by financial incentives, some MTurk workers
created automated bots to take as many surveys as possible (Dreyfuss,
2018), whereas some of them lied about their age, residency, and other
demographic attributes in order to meet the inclusion criteria. On some
occasions, some people identified themselves as lesbian, gay, bisexual,
or suicidal just because it is “funny” (Cimpian, 2022). Further, CASE
Fraud Detection Study (Ribeiro, 2021) found that 24% of respondents
entered over 25 different surveys within 24 hours. No doubt the quality
of these inattentive or even fraudulent responses are problematic.
Although statistical software packages are capable of
calculating
numbers up to 16-32 decimals, this precision is meaningless if the data
cannot be accurate at even the integer level. Quite a few scholars had
warned researchers how measurement error could cripple statistical
analysis (Blalock, 1974) and suggested that good research practice
requires the examination of the quality of the data collected (Fetter,
Stowe, & Owings, 1984).
Bias and Variance
Measurement errors include two components, namely, bias
and variable error.
Bias is a systematic error that tends to push the reported scores
toward one extreme end. For example, several versions of IQ tests are
found to be bias against non-Whites. It means that blacks and Hispanics
tend to receive lower scores regardless of their actual intelligence. A
variable error, also known as variance, tends to be
random. In
other words, the reported scores could be either above or below the
actual scores (Salvucci, Walter, Conley, Fink, & Saba, 1997).
The findings of these two types of measurement errors
have different
implications. For example, in a study comparing self-reported data of
height and weight with direct measured data (Hart & Tomazic,
1999),
it was found that subjects tend to over-report their height but
under-report their weight. Obviously, this kind of error pattern is
bias rather than variance. A possible explanation of this bias is that
most people want to present a better physical image to others. However,
if the measurement error is random, the explanation may be more
complicated.
One may argue that variable errors, which are random
in nature, would
cancel out each other and thus may not be a threat to the study. For
example, the first user may over-estimate his Internet activities by
10%, but the second user may under-estimate hers by 10%. In this case,
the mean might still be correct. However, over-estimation and
under-estimation increases variability of the distribution. In many
parametric tests, the within-group variability
is used as the error term. An inflated variability would definitely
affect the significance of the test. Some texts may reinforce the above
misconception. For example, Deese (1972) said,
Statistical
theory tells us that the
reliability of observations is proportional to the square root of their
number. The more observations there are, the more random influences
there will be. And statistical theory holds that the more random errors
there are, the more they are likely to cancel one another and produce a
normal distribution (p.55).
First, it is true that as the sample size increases the variance of the
distribution decreases, it does not guarantee that the shape of
distribution would approach normality. Second, reliability (the quality
of data) should be tied to measurement rather than sample size
determination. A large sample size with a lot of measurement errors,
even random errors, would inflate the error term for parametric tests.
A stem-and-leaf plot or a histogram can be used to
visually examine whether a measurement error is due to systematic bias
or random variance. In the following example, two types of Internet
access (Web browsing and email) are measured by both self-reported
survey and logbook. The difference scores (measurement 1 - measurement
2) are plotted in the following histograms.
The first graph reveals that most difference scores
are centered around zero. Under-reporting and over-reporting appears
near both ends suggest that the measurement error is random error
rather than systematic bias.
The second graph clearly indicates that there is a
high degree of
measurement errors because very few difference scores are centered
around zero. Moreover, the distribution is negatively skewed and thus
the error is bias instead of variance.
How reliable our memory is?
Schacter (1999) warned that the human memory is fallible. There are
seven flaws of our memory:
- Transience: Decreasing
accessibility of information over time.
- Absent-mindedness: Inattentive
or shallow processing that contributes to weak memories.
- Blocking: The temporary
inaccessibility of information that is stored in memory.
- Misattribution Attributing a
recollection or idea to the wrong source.
- Suggestibility: Memories that
are implanted as a result of leading questions or expectations.
- Bias: Retrospective distortions
and unconscious influences that are related to current knowledge and
beliefs.
- Persistence: Pathological
remembrances-information or events that we cannot forget, even though
we wish we could.

|
"I have no
recollection of these. I don't recall that I signed the document for
Whitewater. I don't remember why the document disappeared but
reappeared later. I don't remember anything."
"I remember landing (in Bosnia) under sniper fire. There was supposed
to be some kind of a greeting ceremony at the airport, but instead we
just ran with our heads down to get into the vehicles to get to our
base."
During the investigation of sending classified information via a
personal email server, Clinton told FBI that she could not "recall" or
"remember" anything 39 times.
Caution:
A new computer virus named
"Clinton" is discovered. If the computer is infected, it will
frequently pop up this message 'out of memory,' even if it has adequate
RAM.
|
| |
|
Q: "If Vernon Jordon has told us that you have an extraordinary memory,
one of the greatest memories he has ever seen in a politician, would
this be something you would care to dispute?"
A:
"I do have a good memory...But I
don't remember whether I was alone with Monica Lewinsky or not. How
could I keep track of so many women in my life?"
Q:
Why did Clinton recommend Lewinsky for a job at Revlon?
A:
He knew she would be good at making things up.
|
 |
It is important to note that sometime the reliability
of our memory is
tied to the desirability of the outcome. For example, when a medical
researcher tries to collect relevant data from mothers whose babies are
healthy and mothers whose kids are malformed, the data from the latter
is usually more accurate than that of the former. This is because
mothers of malformed babies have been carefully reviewing every illness
that occurred during the pregnancy, every drug taken, every detail
directly or remotely related to the tragedy in an attempt to find an
explanation. On the contrary, mothers of healthy infants do not pay
much attention to the preceding information (Aschengrau & Seage
III, 2008). Inflating GPA is another example of how desirability
affects memory accuracy and data integrity. In some situation there is
a gender difference in GPA inflation. A study conducted by Caskie et
al. (2014) found that within the group of lower GPA undergraduate
students, females were more likely to report a higher than actual GPA
than males.
To counteract the problem of memory errors, some
researchers
suggested collecting data related to the momentary thought or feeling
of the participant, rather than asking him or her to recall remote
events (Csikszentmihalyi & Larson, 1987; Finnigan &
Vazire,
2018). The following examples are survey items in 2018 Programme for
International Student Assessment: “Were you treated with respect all
day yesterday?” “Did you smile or laugh a lot yesterday?” “Did you
learn or do something interesting yesterday?” (Organisation for
Economic Cooperation and Development, 2017). However, the response
depends on what happened to the participant around that particular
moment, which might not be typical. Specifically, even though the
respondent did not smile or laugh a lot yesterday, it doesn’t
necessarily imply that the respondent is always unhappy.
What shall we do?
On some occasions, the issue of questionable data quality, particularly due to social desirability bias, can originate from the researcher's actions. For instance, when an institutional review board (IRB) mandates the disclosure of the study's aim in the informed consent form, and the researcher explicitly mentions goals like "investigating bias and discrimination" or "assessing the impact of excessive social media use on academic performance," it's almost inevitable that participants might tailor their responses to align with socially desirable outcomes. Researchers sometimes employ ambiguous language to obscure the true purpose of the study. However, the survey's title, such as the Perceived Racism Scale (PRS) or the Psychopathic Personality Traits Scale (PPTS), displayed prominently on the survey, can inadvertently reveal the study's focus. A straightforward solution to mitigate this issue is to omit any language from the informed consent that could hint at the research objectives.
Some researchers reject use of self-reported data due to its alleged
poor quality. For example, when a group of researchers investigated
whether high religiosity led to less adherence to shelter-in-place
directives in the US during the COVID19 pandemic, they used the number
of congregations per 10,000 residents as a proxy measure of religiosity
of the region, instead of self-report religiosity, which tends to
reflect social desirability (DeFranza, Lindow, Harrison, Mishra,
&
Mishra, 2021).
However, Chan (2009) argued that the so-called poor quality of
self-reported data is nothing more than an urban legend.
Driven by social desirability, respondents might provide the
researchers with inaccurate data on some occasions, but it does not
happen all the time. For example, it is unlikely that the respondents
would lie about their demographics, such as gender and ethnicity.
Second, while it is true that respondents tend to fake their answers in
experimental studies, this issue is less serious in measures used in
field studies and naturalistic settings. Further, there are numerous
well-established self-reported measures of different psychological
constructs, which have obtained construct validity evidence through
both convergent and discriminant validation. For example, Big-five
personality traits, proactive personality, affectivity disposition,
self-efficacy, goal orientations, perceived organizational support, and
many others.
In
the field of epidemiology, Khoury, James and Erickson (1994) asserted
that the effect of recall bias is over-rated. But their conclusion may
not be well-applied to other fields, such as education and psychology.
In spite of the threat of data inaccuracy, it is impossible for the
researcher to follow every subject with a camcorder and record every
thing they do. Nonetheless, the researcher can use a subset of subjects
to obtain observed data such as user log access or daily hardcopy log
of web access. The results would then be compared to the outcome of all
subjects¹ self-reported data for an estimation of measurement error.
For example,
- When the user access log is available to the
researcher, he can ask
the subjects to report the frequency of their access to the web server.
The subjects should not be informed that their Internet activities have
been logged by the webmaster as this may affect participant behavior.
- The researcher can ask a subset of users to keep a
log
book of their internet activities for a month. Afterwards, the same
users are asked to fill out a survey regarding their web usage.
Someone may argue that the log book approach is too demanding. Indeed,
in many scientific research studies, subjects are asked for much more
than that. For instance, when scientists studied how deep sleep during
long range space travel would affect human health, participants were
asked to lie in bed for a month. In a study concerning how a closed
environment affects human psychology during space travel, subjects were
locked in a room individually for a month, too. It takes a high cost to
seek out scientific truths.
After different sources of data are collected, the
discrepancy between
the log and the self-reported data can be analyzed to estimate the data
reliability. At first glance, this approach looks like a test-retest
reliability, but it isn't. First, in test-retest reliability the
instrument used in two or more situations should be the same. Second,
when the test-retest reliability is low, the source of errors is within
the instrument. However, when the source of errors is external to the
instrument such as human errors, inter-rater reliability is more
appropriate.
The above suggested procedure can be conceptualized as
a measurement of
inter-data reliability, which resembles that of inter-rater reliability
and repeated measures. There are four ways to estimate the inter-rater
reliability, namely, Kappa coefficient, Index of Inconsistency,
repeated measures ANOVA, and regression analysis. The following section
describes how these inter-rater reliability measurements may be used as
inter-data reliability measurements.
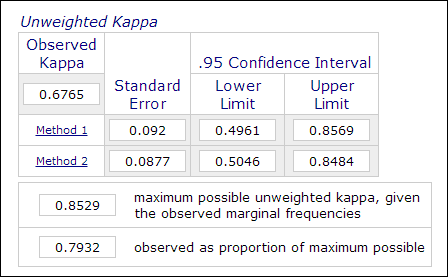
Kappa coefficient
In psychological and educational
research, it is not unusual to employ two or more raters in the
measurement process when the assessment involves subjective judgments
(e.g. grading essays). The inter-rater reliability, which is measured
by Kappa coefficient, is used to indicate the reliability of the data.
For example, the performance of the participants are graded by two or
more raters as "master" or "non-master" (1 or 0). Thus, this
measurement is usually computed in categorical data analysis procedures
such as PROC FREQ in SAS, "measurement of agreement" in SPSS, or an
online Kappa calculator (Lowry, 2016). The image below is a screenshot
of Vassarstats online calculator.
It is important to note that even if 60 percent of two datasets concur
with each other, it doesn't mean that the measurements are reliable.
Since the outcome is dichotomous, there is a 50 percent chance that the
two measurements agree. Kappa coefficient takes this into account and
demands a higher degree of matching to reach consistency.
In the context of Web-based instruction, each category
of
self-reported Website usage can be re-coded as a binary variable. For
example, when question one is "how often do you use telnet," the
possible categorical responses are "a: daily," "b: three to five times
per weel," "c: three-five times per month," "d: rarely," and "e:
never." In this case, the five categories can be recoded into five
variables: Q1A, Q1B, Q1C, Q1D, and Q1E. Then all these binary variables
can be appended to form a R X 2 table as shown in the following table.
With this data structure, responses can be coded as "1" or "0" and thus
measurement of classification agreement is possible. The agreement can
be computed using Kappa coefficient and thereby the reliability of the
data may be estimated.
| Subjects |
Log
book data |
Self-report
data |
| Subject 1 |
1 |
1 |
| Subject 2 |
0 |
0 |
| Subject 3 |
1 |
0 |
| Subject 4 |
0 |
1 |
Index of Inconsistency
Another way to compute the aforementioned categorical data is Index of
Inconsistency (IOI). In the above example, because there are two
measurements (log and self-reported data) and five options in the
answer, a 4 X 4 table is formed. The first step to compute IOI is to
divide the RXC table into several 2X2 sub-tables. For example, the last
option "never" is treated as one category and all the rest are
collapsed into another category as "not never," as shown in the
following table.
|
Self-reported
data
|
| Log |
|
Never |
Not never |
Total |
| Never |
a |
b |
a+b |
| Not Never |
c |
d |
c+d |
| Total |
a+c |
b+d |
n=Sum(a-d) |
The percent of IOI is computed by the following formula:
IOI% = 100*(b+c)/[(2np(1-p)] where p = (a+c)/n
After
the IOI is calculated for each 2X2 sub-table, an average of all indices
is used as an indicator of the inconsistency of the measure. The
criterion to judge whether the data are consistent is as follows:
- An IOI of less than 20 is low variance
- An IOI between 20 and 50 is moderate variance
- An IOI above 50 is high variance
The reliability of the data is expressed in this
equation: r = 1 - IOI
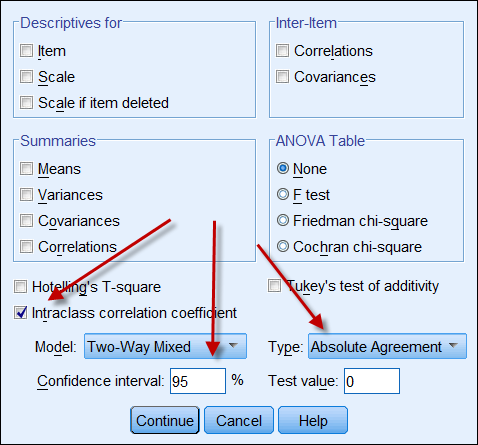
Intraclass correlation coefficient
If both data sources yield continuous data, then one can compute
intraclass correlation coefficient to indicate the reliability of the
data. The following is a screenshot of SPSS's ICC options. In Type
there are two options: "consistency" and "absolute agreement." If
"consistency" is chosen, then even if one set of numbers is consistency
high (e.g. 9, 8, 9, 8, 7...) and the other is consistency low (e.g. 4,
3, 4, 3, 2...), their strong correlation mis-implies that the data are
in alignment with each other. Hence, it is advisable to choose
"absolute agreement."
Repeated measures
The measurement of inter-data reliability
can also be conceptualized and proceduralized as a repeated measures
ANOVA. In a repeated measures ANOVA, measurements are given to the same
subjects several times such as pretest, midterm and posttest. In this
context, the subjects are also measured repeatedly by the web user log,
the log book and the self-reported survey. The following is the SAS
code for a repeated measures ANOVA:
	data one; input user $ web_log log_book self_report;
	cards;
	1 215 260 200
	2 178 200 150
	3 100 111 120
	4 135 172 100
	5 139 150 140
	6 198 200 230
	7 135 150 180
	8 120 110 100
	9 289 276 300
	proc glm;
	classes user;
 model web_log log_book self_report = user;
 repeated time 3;
	run;
|
In the above program, the number of visited Websites by nine volunteers
are recorded in the user access log, the personal log book, and the
self-reported survey. The users are treated as a between-subject
factor while the three measures are regarded as between-measure
factor. The following is a condensed output:
| Source
of variation |
DF |
Mean
Square |
| Between-subject (user) |
8 |
10442.50 |
| Between-measure (time) |
2 |
488.93 |
| Residual |
16 |
454.80 |
Based on the above information, the reliability coefficient can be
calculated using this formula (Fisher, 1946; Horst, 1949):
| r
= |
MSbetween-measure
- MSresidual
|
|
--------------------------------------------------------------
|
|
MSbetween-measure
+ (dfbetween-people X MSresidual)
|
Let's plug the number into the formula:
| r
= |
488.93
- 454.80
|
|
---------------------------------------
|
|
488.93
+ ( 8 X 454.80)
|
The reliability is about .0008, which is extremely
low. Therefore, we
can go home and forget about the data. Fortunately, it is only a
hypothetical data set. But, what if it is a real data set? You have to
be tough enough to give up poor data rather than publishing some
findings that are totally unreliable.
Correlational and regression analysis
Correlational analysis, which utilizes Pearson's Product Moment
coefficient, is very simple and especially useful when the scales of
two measurements are not the same. For example, the web server log may
track the number of pages accesses while the self-reported data are
Likert-scaled (e.g. How often do you browse the Internet? 5=very often,
4=often, 3=sometimes, 2=seldom, 5=never). In this case, the
self-reported scores can be used as a predictor to regress against page
access.
A similar approach is regression analysis, in which
one set of scores
(e.g. survey data) is treated as the predictor while another set of
scores (e.g. user daily log) is considered the dependent variable. If
more than two measures are employed, a multiple regression model can be
applied i.e. the one that yields more accurate result (e.g. Web user
access log) is regarded as the dependent variable and all other
measures (e.g. user daily log, survey data) are treated as independent
variables.
Reference
- Aschengrau, A., & Seage III, G. (2008). Essentials
of epidemiology in public health. Boston, MA: Jones and
Bartlett Publishers.
- Blalock, H. M. (1974). (Ed.) Measurement in
the social sciences: Theories and strategies. Chicago,
Illinois: Aldine Publishing Company.
- Caskie, G. I. L., Sutton, M. C., & Eckhardt,
A. G.
(2014). Accuracy of self-reported college GPA: Gender-moderated
differences by achievement level and academic self-efficacy. Journal of College Student
Development, 55, 385-390. 10.1353/csd.2014.0038
- Chan, D. (2009). So why ask me? Are self report data
really that bad? In Charles E. Lance and Robert J. Vandenberg (Eds.), Statistical
and methodological myths and urban legends: Doctrine,
verity and fable in the organizational and social sciences (pp309-335).
New York, NY: Routledge.
- Cimpian, J. (2022, September). How invalid and mischievous survey responses bias estimates between groups. Paper presented at Innovations in Online Research Conference, Online.
- Cook, T. D., & Campbell, D. T. (1979). Quasi-experimentation:
Design and analysis issues. Boston, MA: Houghton Mifflin
Company.
- Csikszentmihalyi, M., & Larson, R. (1987). Validity and reliability
of the experience-sampling method. Journal of Nervous and Mental
Disease, 175, 526–536.
https://doi.org/10.1097/00005053-198709000-00004
- Deese, J. (1972). Psychology as science and
art. New York, NY: Harcourt Brace Jovanovich, Inc.
- DeFranza, D., Lindow, M., Harrison, K., Mishra, A.,
&
Mishra, H. (2021). Religion and reactance to COVID-19
mitigation guidelines. American
Psychologist, 76(5), 744–754.
http://dx.doi.org/10.1037/amp0000717.
- Dreyfuss,
E. (2018, August 17). A bot panic hits Amazon's Mechanical Turk:
Concerned social scientists turned their analytical skills onto one of
their most widely used research tools this week: Amazon's Mechanical
Turk. Wired. https://www.wired.com/story/amazon-mechanical-turk-bot-panic/
- Fetters, W., Stowe, P., & Owings, J. (1984). High
School and Beyond. A national longitudinal study for the 1980s, quality
of responses of high school students to questionnaire items. (NCES
84-216).
Washington, D. C.: U.S. Department of Education. Office of Educational
Research and Improvement. National center for Education Statistics.
- Finnigan, K. M., & Vazire, S. (2018). The
incremental
validity of average state self-reports over global self-reports of
personality. Journal
of Personality and Social Psychology, 115, 321–337.
https://doi.org/10.1037/pspp0000136
- Fisher, R. J. (1946). Statistical methods
for research workers (10th ed.). Edinburgh, UK: Oliver and
Boyd.
- Hadaway, C. K., & Marlar, P. L. (2005). How
many
Americans attend worship each week? An alternative approach to
measurement? Journal
for the Scientific Study of Religion, 44, 307-322. DOI:
10.1111/j.1468-5906.2005.00288.x
- Hart, W.; & Tomazic, T. (1999 August).
Comparison of
percentile distributions for anthropometric measures between three data
sets. Paper presented at the Annual Joint Statistical Meeting,
Baltimore, MD.
- Horst, P. (1949). A Generalized expression for the
reliability of measures. Psychometrika, 14, 21-31.
- Khoury, M., James, L., & Erikson, J. (1994).
On the
use of affected controls to address recall bias in case-control studies
of birth defects. Teratology, 49, 273-281.
- Loftus, E. (2016, April). The fiction of memory.
Paper presented at the Western Psychological Association Convention.
Long Beach, CA.
- Lowry, R. (2016). Kappa as a measure of concordance
in categorical sorting. Retrieved from http://vassarstats.net/kappa.html
- Organisation for Economic Cooperation and
Development. (2017). Well-being
questionnaire for PISA 2018. Paris: Author. Retrieved from
https://www.oecd.org/pisa/data/2018database/CY7_201710_QST_MS_WBQ_NoNotes_final.pdf
- Ribeiro, E. (2022, September). The unintended consequences of research automation. Paper presented at Innovations in Online Research Conference, Online.
- Schacter, D. L. (1999). The seven sins of memory:
Insights from psychology and cognitive neuroscience. American
Psychology, 54, 182-203.
- Salvucci, S.; Walter, E., Conley, V; Fink, S;
& Saba, M. (1997). Measurement error studies at the
National Center for Education Statistics. Washington D. C.:
U. S. Department of Education.
- Stephens-Davidowitz, S. (2017). Everybody lies: Big
data, new data, and what the Internet can tell us about who we really
are. New York, NY: Dey Street Books.
 Go up to the main menu Go up to the main menu
|
|