Problem
I am a graduate student who is conducting a research project for my
thesis. I can't wait to graduate! I would like to find out whether my
instrument is reliable in order to proceed with my data collection. I heard about using alternate forms and test-retest to
estimate reliability. But due to lack of resources, I cannot afford to
write two tests or administer the same test in two different
times. With only one test result, what should I do to evaluate the
reliability of my measurement tool?
Which reliability coefficients should I use?
You may compute Cronbach Coefficient Alpha, Kuder Richardson (KR) Formula, or split-half Reliability Coefficient to check for the internal consistency within a single test.
Cronbach Alpha is recommended over the other two for the following reasons:
- Cronbach Alpha can be used for both binary-type and wide-scaled
data. On the other hand, KR can be applied to dichotomously-scored data
only. For example, if your test questions are multiple
choices or true/false, the responses must be binary in nature (either
right or wrong). But if your test is composed of essay-type questions
and each question worths 10 points, then the scale is
ranged from 0 to 10.
- Split-half can be viewed as a one-test equivalent to alternate
form and test-retest, which use two tests. In split-half, you treat one
single test as two tests by dividing the items into two
subsets. Reliability is estimated by computing the correlation between
the two subsets. For example, let's assume that you calculate the
subtotal scores of all even numbered items and the subtotal of
all odd numbered items. The two sets of scores are as the following:
| Students/Items |
Odd |
Even |
| 1 |
10 |
9 |
| 2 |
7 |
5 |
| 3 |
8 |
7 |
| 4 |
9 |
10 |
| 5 |
11 |
10 |
You can simply calculate the correlation of these two sets of scores to check the internal
consistency. The key is "internal." Unlike test-retest and alternate
form that require another
test as an external reference, split-half uses test items within the
same test as an internal reference. If the correlation of the two sets
of scores is low, it implies that some people received high
scores on odd items but received low scores on even items while other
people received high scores on even items but received low scores on
odd items. In other words, the response pattern is
inconsistent.
The drawback is that the outcome is determined by how you group the
items. The default of SPSS is to divide the test into first half and
second half. A more common practice is to group odd-number
items and even-number items. Therefore, the reliability coefficient may
vary due to different grouping methods. On the other hand, Cronbach is
the mean of all possible split-half coefficients that
are computed by the Rulon method.
What is Cronbach Alpha Coefficient?
"OK, Cronbach Alpha is good. But what is Cronbach Alpha?" Cronbach
Alpha coefficient is invented by Professor Cronbach, of course. It is a
measure of squared correlation between observed scores and
true scores. Put another way, reliability is measured in terms of the
ratio of true score variance to observed score variance. "Wow! Sound
very technical. My committee will like that. But what does
it mean?"
The theory behind it is that the observed score is equal to the
true score plus the measurement error (Y = T + E). For example, I know
80% of the materials but my score is 85% because of lucky guessing.
In this case, my observed score is 85 while my true score is 80. The
additional five points are due to the measurement error. A reliable
test should minimize the measurement error so that the error is
not highly correlated with the true score. On the other hand, the
relationship between true score and observed score should be strong.
Cronbach Alpha examines this relationship.
How to compute Cronbach Alpha
Either SAS or SPSS can perform this analysis. SAS is a better choice
due to its better detail. The following illustration is based upon the
data of the Eruditio project, which is sponsored by U.S.
West Communications. The SAS syntax to run Cronbach Alpha is as the
following:
 Data one;
     input post_em1-post_em5;
 cards;
 1 1 1 0 0 1
 1 0 1 1 1 0
 1 1 1 1 1 1
 0 0 0 1 1 1
 0 1 0 1 0 1
   proc corr alpha nocorr nomiss; var post_em1-post_em5; run;
|
In this example, the "nocorr" option suppresses the item correlation
information. Although the correlation matrix can be used to examine
whether particular items are negatively correlated with others, a more
efficient way is to check the table entitled "if items are deleted�K"
This table tells you whether particular items are negatively correlated
with the total and thus it is recommended to suppress the correlation
matrix from the output. "If items are deleted�K" will be explained in a
later section.
It is important to include the "nomiss" option in the procedure
statement. If the test taker or the survey participant did not answer
several questions, Cronbach Alpha will not be computed. In surveys, it
is not unusual for respondents to skip questions that they don't want
to answer. Also, if you use a scanning device to record responses,
slight pencil marks may not be detected by the scanner. In both cases,
you will have "holes" in your data set and Cronbach Alpha procedure
will be halted. To prevent this problem from happening, the "nomiss"
option tells SAS to ignore cases that have missing values.
However, in the preceding aproach, even if the test taker or the
survey participant skips one question, his entire test will be ignored
by SAS. In a speeded test where test taker or the survey participants
may not be able to complete all items, the use of
"nomiss" will lead to some loss of information. One way to overcome
this problem is to set a criterion for a valid test response. Assume
that 80 percent of test items must be answered in order to be
included into the analysis, the following SAS code should be
implemented:
 Data one; infile "c:\data";
    input x1-x5;
    if nmiss(of x1-x5) > 1 then delete;
    array x{I} x1-x5;
        do I=1 to 5;
        if X(I) =. then X(I) = 0;
    proc corr alpha nomiss; var x1-x5; run;
|
In the preceding SAS code, if a record has more than one unanswered
questions (80%), the record will be deleted. In the remaining records,
the missing values will be replaced by a zero and thus
these records will be counted into the analysis.
It is acceptable to count missing responses of a test as wrong
answers and assign a value of "zero" to them. But it is not appropriate
to do so if the instrument is a survey such as an attitude
scale. One of the popular approaches for dealing with missing data in
surveys is the mean replacement method (Afifi ∓ Elashoff, 1966), in which means are used to replace missing data. The
SAS source code for the replacement is the same as the preceding one except the following line:
if X(I) =. then X(I) = mean(of x1-x5);
|
Although this popular method
is convenient, it may not be the best. SAS provides users with various
imputation methods, such as PROC MI and PROC MIANALYSE. Fully conditional specification (FCS) method is recommended (Berglund & Heeringa, 2014)..
How to interpret the SAS output
Descriptive statistics
The mean output as shown below tells you how difficult the items are.
Because in this case the answer is either right (1) or wrong (0). The
mean is ranging from 0 to 1. 0.9 indicates that the
question is fairly easy and thus 90% of the test taker or the survey
participants scored it. It is a common mistake that people look at each
item individually and throw out the item that appears to be too
difficult or too easy.
Actually you should take the entire test into consideration. This will
be discussed later.
Raw and standardized Cronbach Coefficient Alpha
 Cronbach Coefficient Alpha

 for RAW variables         :  0.305078
 for STANDARDIZED variables:  0.292081
|
Cronbach Alpha procedure returns two coefficients:
- Standardized: It is based upon item correlation. The stronger the items are inter-related, the more likely the test is consistent.
- Raw: It is based upon item covariance. Variance is a measure of how a distribution of a single variable (item) spreads out. Covariance is a
measure of the distributions of two variables. The higher the correlation coefficient is, the higher the covariance is.
Some
people mistakenly believe that the standardized Alpha is superior to
the raw Alpha because they thought that standardization normalizes
skewed data. Actually standardization is a linear transformation, and
thus it never normalizes data. Standardized Alpha is not superior to
its raw counterpart. It is used when scales are comparable, because as
mentioned before, variance and covariance are taken into account for
computation. The concepts of variance and covariance are better illustrated
graphically. In one variable, the distribution is a bell-curve if it is
normal. In two variables the distribution appears to be a mountain as
the following.
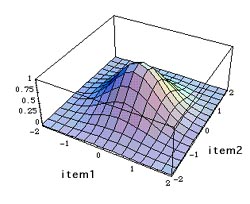
In the above example, both item1 and item2 has a mean of zero
because the computation of covariance uses standardized scores
(z-score). From the shape of the "mountain," we can tell whether the
response patterns of test taker or the survey participants to item1 and
item 2 are consistent. If the mountain peak is at or near 'zero' and
the slopes of all directions spread out evenly, we can conclude that
the items are
consistent.
However, in order to determine whether the entire test is
consistent, we must go beyond just one pair. Cronbach Alpha computation
examines the covariance matrix--all possible pairs to draw a
conclusion. But not all the information on the matrix is usable. For
example, the pairs of the item itself such as (item1, item1) can be
omitted. Also, the order of the pair doesn't matter i.e. the
covariance of pair ( item1, item2) is the same as that of (item2, item1)
|
Item1 |
Item2 |
Item3 |
Item4 |
Item5 |
| item1 |
|
Covariance |
Covariance |
Covariance |
Covariance |
| item2 |
|
|
Covariance |
Covariance |
Covariance |
| item3 |
|
|
|
Covariance |
Covariance |
| item4 |
|
|
|
|
Covariance |
| item5 |
|
|
|
|
|
Generally speaking, the higher the Alpha is, the more reliable the
test is. There isn't
a generally agreed cut-off. Usually 0.7 and above is acceptable
(Nunnally, 1978). It is a common misconception that if the Alpha is
low, it must
be a bad test. Please keep in mind that this cut-off point is by no
means absolute. First, the commonly accepted cut-off is neither a
result of empirical research nor a product of logical reasoning.
Rather, it is nothing more than Nunnally’s personal opinion. Second,
the computation of the Cronbach Alpha assumes that the item errors are
independent and each item on the test contributes equally to the total
score by showing similar standardized factor loadings (Tau
equivalence). When the first assumption is met and the second one is
violated, the Cronbach Alpha becomes a lower bound estimate of
reliability. In some cases, when the estimate of Cronbach alpha is as
low as .5, the actual one is .7. Fourth, the Cronbach Alpha is subject
to both internal relatedness of item responses and the number of items
in the scale. For example, when a particular test consists of 36
questions, the Alpha is as high as .8. But when the number of items is
reduced to 21, the Alpha becomes .7. Thus, we cannot make a firm
conclusion about the test reliability based on the Cronbach Alpha alone
(Cho & Kim, 2015; McNeish, 2017).
Your test may measure several
attributes/dimensions rather than one and this information cannot be
revealed by the Cronbach Alpha. For example, it is expected that the
scores of GRE-Verbal,
GRE-Quantitative, and GRE-Analytical may not be
highly correlated because they evaluate different types of knowledge.
You may want to perform
factor analysis to combine items into a few factors. You may also drop
the items that affect the overall consistency, which will
be discussed next.
It is very important to notice that Cronach Alpha takes variance
(spread of the distribution) into account. For example, when you
compare the mean scores in the following two tables, you can find
that both pre-test and post-test responses are consistent,
respectively. However, the Alpha of post-test is only .30 (raw) and .29
(standardized) while the Alpha of pre-test is as high as .60 (raw
and standardized). It is because the standard deviation (SD) of the
post-test ranges from .17 to .28 but the SD of the pre-test is more
consistent (.42-.48).
If the item is deleted...
As I mentioned before, a good analysis of test items should take the
whole test into consideration. The following table tells you how each
item is correlated with the entire test and what the Alpha
will be if that variable is deleted. For example, the first line shows
you the correlation coefficient between post-test item 1 and the
composite score of post-test item1-item5. The first item is
negatively correlated with the total score. If it is deleted, the Alpha
will be improved to .41 (raw) or .42 (standardized). Question 5 has the
strongest relationship with the entire test. If this
item is removed, the Alpha will be dropped to -.01 (raw) or .04
(standardized). This approach helps you to spot the bad apple and
retain the good one.
Once again, variance plays a vital role in Cronbach Alpha
calculation. Without variance there will be no result. The following
quetions are from another post-test. Everybody scored Question 3 and
4 (1.00) but missed Question 4 (0.00). Because there is no variance,
standardized Cronbach Alpha, which is based on covariance matrix,
cannot be computed at all.
Updated: August, 2020
References
Afifi, A. A., & Elashoff, R. M. (1966). Missing observations in multivariate statistics. Part I. review of the literature. Journal of the American Statistical Association, 61, 595-604.
Berglund, P. & Heeringa, S. (2014). Multple imputation of missing data using SAS. Cary, NC: SAS Institute.
Cho, E. S, & Kim, S. H. (2015). Cronbach's coefficient alpha: Well known but poorly understood. Organizational Research Methods, 18, 207-230. DOI: 10.1177/1094428114555994.
McNeish, D. (2018). Thanks coefficient alpha, we’ll take it from here. Psychological Methods, 23, 412-433.
Nunnally, J. C. (1978). Psychometric theory (2nd ed.). New York: McGraw-Hill.
Navigation

Contact me
|