Dissertation Summary
The interaction of
research goal, data type, & graphical format in
multivariate visualization
ABSTRACT
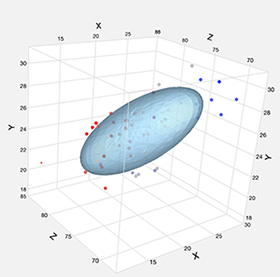
- Problem: While physical and engineering
scientists endorse the use of high-dimensional graphics
for data analysis, several psychologists have been unable
to confirm the effectiveness of three-dimensional graphs.
- Framework: To explain this discrepancy, this
study proposed an alignment framework maintaining that a
successful data visualization results from the proper
combination of data, task, and graph types.
- Hypothesis:
- Based upon the alignment framework, it was
hypothesized that under conditions of medium and large
data sets 3D graphs would outperform their 2D
counterparts for the tasks of examining relationships
and spotting outliers.
- Also, it was expected performance would not vary
across graphical formats when small data sets were
used.
- Findings: Twenty-three graduate students with
experience in data visualization participated in an
experiment to test these hypotheses. Superior performance
for 3D graphics was found across all data sizes for both
research tasks. Results are largely consistent with the
theoretical expectations derived from the alignment
framework.
Part of my dissertation is included in my 2014
book, Dancing with the Data: The Art and Science of Data
Visualization. You can view an example of animation
visualization [here].
Although the dissertation was completed many years ago, it
laid the foundation for subsequent research in data
visualization. Today, data visualization is an integral part
of data science. I have been teaching and
conducting research in this field for
many years. Please feel free to contact me if you have any
questions.