Standardized Tests
Chong Ho Yu, Ph.D.s
|
A few notes
- You may wonder why you should learn these statistical concepts and
procedures. You may think that you will never use these kinds of math
in the rest of your life. When I was an undergraduate student, I also
looked at math in this way. However, when someday you do works
regarding research or administration, it will be inevitable for you to
come across the following statistical concepts. You may not need to
compute them yourself, but at least you should be able to interpret
them.
- As you know the first half of this class is devoted to
alternative assessment models, as opposed to the conventional
bell-curve approach. It is up to you to stand with either side.
However, if you want to criticize the bell-curve approach, you should
understand how it works first.
- The materials in these two lessons are simple basics.
Instead of assigning you to read statistical textbooks, I have already
simplified the materials for you (The lecture contents are based upon
Kubiszyn & Borich's Educational testing and measurement, and Crocker & Algina's Introduction to classical and modern test theory).The test will cover the fundamental information only.
Table of Contents
- Comparisons betwwen Standardized and Custom-made tests
- Standard Scores
- Formula for Z Scores
- Characteristics of Z score
- Standard Normal Distribution
- Percentiles
- Summary
A Comparison of Standardized and Custom-made Tests
| | Standardized | Custom-Made
|
| Learning Outcomes
| Measure general
outcomes and content relevant to the majority of students. The tests
tend not to reflect specific emphases of local curricula. There is no
national standard in the US though there is a common core standard
across several states. Thus, some standardized tests reflect the state
requirment only.
| Aapted to the specific outcomes and contents of a local curriculum, but tend to neglect complex learning outcomes.
|
| Quality of test items
| Qualty of items generally is high. Items are written by content experts and validated by psychometricians.
| Quality of items is often unknown or may be lower than that of standardized tests due to the limited local resources.
|
| Reliability
| Reliability is usually high.
| Reliability is usually unknown.
|
| Administration and scoring
| Procedures are standardized and instructions are specified.
| Uniform procedures are possible, but usually are flexible and undocumented.
|
| Interpretation of scores
| Scores can be compared to norm groups based on complex sampling schemes (e.g. multi-stage).
Test manual and other guides are provided.
| Score comparisons and interpretations are confined to local settings. Few guidelines are available for interpretation and use.
|
To determine how well a student did in a test or to compare scores across
different tests, you need to interpret the scores in terms of the means and
standard deviations of the respective distributions. Essentially, each score
must be evaluated in terms of its relative standing, or position, in the
distribution.
A score alone cannot tell how well a student did. For exmple, is 90 a good
score? Well, perhaps the majority gets above 95 and thus 90 is considered a "C"! Is
65 a poor score? If the mean is 40, then 65 may be an "A"! Because the first
test score may be 1 standard deviation below the mean and the second
score may be 1.5 standard deviations above the mean. Doing this for each
score in its respective distribution gives us the measures of relative standing, which are known as Z scores.
To find out how many standard deviations a score departs from the mean, subtract the
mean from the score and then divide the result by the standard deviation. So Z scores are
defined by...

A general verbal formula for a Z score is a score minus its mean divided
by its standard deviation. This formula is appropriate for describing the
relative position of an original raw score in a sample and can be used to
compare two or more scores from the same or different distributions. For
example, you can compare your score on the first quiz in a given course to
another person's score on that quiz or to your performance on the second quiz.
So converting raw scores to Z scores allow you to compare relative
performances. To describe a score in a population, the following formula would
be used:

- Notice that Z scores are expressed in terms of standard deviation
units. In other words, standard deviations are the units of measure for
Z scores. For an
IQ score with Z=1.5, the score is 1.5 standard deviation units above
the mean.
For a person's height which has Z=2.7, the height is 2.7 standard
deviations
above the mean. Notice that Z scores not only give the distance of the
score
from the mean in standard deviation units, but also the direction of
the score
from the mean by using the sign of the Z score.
- The mean of a set of Z scores is 0 and the variance and standard deviation of a set of Z scores are 1.
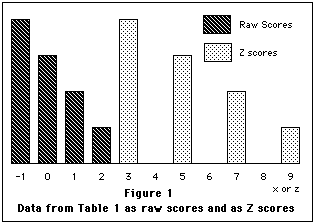
- A final characteristic of z scores is that the
transformation to z scores does not change the shape of the
distribution from that found for X. If the
distribution of X is positively skewed, then the distribution of z scores
computed from the X scores is also positively skewed. Whatever the shape of
the distribution of X is, the distribution of z will have the same shape. Examine
Figure 1 for the graph of the data from Table 1 in both
raw score form and as z scores.

Normal Distributions are:
- symmetric
- continuous
- unimodal
- bell-shaped
- asymtotic
- the mean, median, and mode are the same.

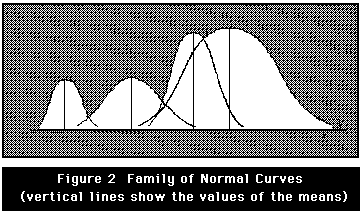
There isn't one univerisal normal distribution. Rather, there is a
family of normal distributions. Normal distributions are essential in
statistics and measurement because of their wide spectrum of
applications. They are good approximations for two types of
distributions: the distributions of some variables, such as IQ, and
the sampling distributions of some statistics, such as means. Also,
normal
distributions play an important role as the theoretical distributions
for scores
used in some statistics and for errors or residuals in measurement
theories.
With these infinitely many normal distributions, how do we find the
proportations of cases in any one distribution? To solve this problem, there
would have to be infinitely many tables that display the proportations, or
would there have to be some transformations which would not change the shape of
the distribution but would give a known mean and variance. The answer is the
transformation from raw to z scores. Since we are transforming any normal
distribution to a standard distribution, the normal distribution with mean=0
and variance=1 is called the standard normal distribution.
Many statistics textbooks provide the readers with tables for score
transformation or locating the relative posiiton, but today it could be
easily accomplished by using software applications (e.g. http://davidmlane.com/hyperstat/z_table.html).
While working with the standard normal distribution, we can
conceptualize the proportion of cases and area under the curve as
interchangeable
concepts. The total area under the curve is 1, and the total of all
proportions
is 1, because area and proportion of cases are the same for theoretical
distributions, such as a normal distribution. Since a proportion is a
relative
number, it must be greater than or equal to 0 and less than or equal to
1. It will never be negative.
Although a standard score tells you the position of a score relative to
the mean, you still have no idea about the score relative
to the rest of the scores in the distribution. Knowing that a raw score
of 15
has z = 1.3 does not tell you what percentage of the scores is less
than 15, or how many students are worse than you. Thus, we need the
percentile rank.
The percentile rank of a score is the percentage of the
distribution (area) below the given score. As shown in the following
table, the 50 percentile
is the mean. A score at the 62 percentile is equivalent to a B or a C.

Z Scores: Computation of z scores gives the relative
standing position of a score: How far is from the mean? Z scores are
centered at 0 and set the standard deviation to 1. But they have the
same
distribution shape as that of the original scores.
Percentile Ranks: It gives the percentage of the population or sample
that is above or below the given score.
Navigation
Simplified Navigation
Table of Contents
Search Engine

Press this icon to contact Dr. Yu via various channels