Standardized Tests (Continued)
Chong Ho Yu, Ph.D.s
|
Table of Contents
Mathematically, the percentile rank is defined as:
p = [cfi + .5(fi)]/N * 100%
where cfi stands for the cumulative frequency, the counts accumulated by the current count and all previous ones, for all scores below the score of
interest, fi is the frequency of scores in the interval of interest, and N is the sample size.
Steps to compute a percentile rank
- Construct a frequency distribution for the raw scores.
- For a given score, determine the cumulative frequency for all scores below the point of interest.
- Add half the frequency for the score of interest to the cf value yielded from step 2.
- Divide the total by N and multiply by 100%.
Table 1 Raw Scores, Frequency Distribution,
& Percentile Rank
| Raw Score | frequency | cumulative freq. | Percentile rank
|
|---|
| 11 | 2 | 2 | 01
|
| 12 | 1 | 3 | 02
|
| 13 | 6 | 9 | 04
|
| 14 | 5 | 14 | 08 |
| 15 | 12 | 26 | 13 |
| 16 | 17 | 43 | 23 |
| 17 | 21 | 64 | 36 |
| 18 | 28 | 92 | 52 |
| 19 | 19 | 111 | 67 |
| 20 | 15 | 126 | 79 |
| 21 | 10 | 136 | 87 |
| 22 | 5 | 141 | 92 |
| 23 | 3 | 144 | 95 |
| 24 | 4 | 148 | 97 |
| 25 | 2 | 150 | 99 |
|
For example, based on the data in Table 1, the percentile rank of a raw score
of 17 is:
P = 43 + (.5)(21)/150 * 100% = 36
- The scale of the percentile rank is a non-linear transformation
of that of the raw score, meaning that at different regions on the raw
score scale, a gain of 1 point may not correspond to a gain of one unit
or the same magnitude on the percentile rank scale.
- Percentile rank scores are less stable or less reliable for scores in the central
part of the distribution than for those in the polars, the two
tails of the distribution.
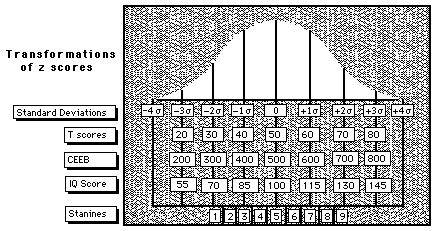
Z scores center on zero. The values below the avaerage (center) are
negatives. It may be difficult to explain to test
users. How can you explain an examinee that his z score is -1.5? If you
tell an average student that his score is zero, he may take it
literally ("I didn't earn any points!") To avoid confusion, it is often
convenient to perform a linear transformation on
z-scores to convert them to values that are easier to record or explain. The
general form of such a transformation is:
y = m + k(z)
where Y is the derived score, and m and k are constant values arbitrarily
chosen for convenience. The value chosen for the
m will be the new center (mean) of the new distribution after the score transformation, and
the value chosen for the k will be its new standard deviation.
T = 50 + 10(z)
y = 500 + 100(z)
IQ = 100 + 15(z)
Stanines are ranges, intervals, or bands within fixed percentages that bracket or include the score.
- They divide the normal curve into nine portions
- Each portion is 1.5 standard deviation wide.
- Mean = 5
- Standard deviation = 2
Table 2 Stanines
| Stanine | Percentage of cases |
|---|
| 1 | 4% (lowest) |
| 2 | 7% |
| 3 | 12% |
| 4 | 17% |
| 5 | 20% |
| 6 | 17% |
| 7 | 12% |
| 8 | 7% |
| 9 | 4% (highest)
|

When children are tested on aptitude or achievement measures, the test user
often wants a normative score which will indicate how a given child's
performance compares with that of others at a particular age or grade level.
- "Alex obtained a math computation grade-equivalent (GE) score of
7.6 (seventh grade, sixth month) on the CAT. That means that even
though hhe's a
fourth grader, he has reached the level of seventh-grade-level math."
The preceding interpretation is incorrect. Alex's obtained
GE score is the estimate made by the test developer indicating the
average seventh-grader during the sixth month of the school. It just
means that Alex's math is above the average.
- Comparisons among GE scores across areas for the same student also may be
misleading. e.g. a GE of 3.5 in reading and 3.5 in science would appear to
imply equal proficiency in the two subjects, but this is not necessarily true.
Although the two scores are equal, the percentile ranks in the two subjects
could be, for example, 69 in reading and 86 in science.
Questions
1. If the z score is 1.5, what are the following scores?
2. Given the following data, compute the percentile rank.
3. My percentile rank in a test is 52 and John's rank in the same
test is 30. "Ha! I am doing much better than John." Am I right? Why or
why not?
4. Dr. Who developed a test and collected data on its reliability. These are what he got:
- Internal consistency: 1.10
- Test-retest reliability: .99
- Equivalency : .99
Because the coefficients exceed the standards, he concluded that his test is highly reliable. Is he right? Why or why not?
Navigation
Index
Simplified Navigation
Table of Contents
Search Engine

Press this icon to contact Dr. Yu via various channels