|
A study of the relationship |

|
Angel Jannasch-Pennell, Ph.D., Samuel A. DiGangi, Ph. D.,
(2000 April) |
|
A study of the relationship |
|
Angel Jannasch-Pennell, Ph.D., Samuel A. DiGangi, Ph. D.,
(2000 April) |
Abstract: Previous research indicates that without adequate background knowledge, statistical learners can miss important details and build up more misconceptions through interactive simulations. To rectify this situation, two types of multimedia, which limited learner control, were employed into a web-based statistical course: linear digital movie and modularized slide shows. It was hypothesized that the instructional effectiveness in terms of correct understanding is tied to the knowledge nature: conceptual and procedural. An interaction effect of the media type and the knowledge type nature was expected. ANOVA did not yield a significant result in the interaction effect, but yielded a significant result in both media and knowledge effects.
This paper examines the efficacy of two types of Web-based multimedia in the learning of statistical concepts and procedures. While non-linear hypertext and interactive hypermedia are gaining popularity, the multimedia modules introduced in this article are designed to be restrictive in linking and interactivity. According to Vygotsky (1962, 1978), learners can construct their own knowledge via exploration. It is not surprising, then, that more and more instructors are using simulations such as Java Applets within supplemental websites to teach statistical concepts and procedures (e.g. West & Ogden, 1998). However, previous research indicates that without adequate background knowledge, statistical learners could miss important details and build up more misconceptions through interactive simulations (Yu, & Behrens, 1995; Yu, Anthony, & Behrens, 1995). Studies on learner control have indicated a similar pattern. Unless already skilled in a given subject, learners who have full control learn less well than those exposed to program control (Steinberg, 1988, Goetzfried & Hannafin, 1985). Introduction
In an attempt to rectify this situation, two types of multimedia were employed into a web-based intermediate statistical course. The first type was QuickTime animation (Apple Inc., 1999), which are linear and non-interactive movies. The second type was JavaScript-based (Flanagan, 1998) slide shows and Director/Shockwave (Macromedia Inc., 1999a) slide shows, which modularized the subject matter into several frames. In this medium the learner had limited navigational paths such as going backward and forward, as well as going to the first screen and last screen. Both media were designed with the intention to limit the learner control, but retain the benefits of multimedia and Web-based instruction. Linear Movies and Modularized Slide Shows
Several years ago the narrowness of bandwidth made video streaming impossible. Today the improvement in network speed and the advancement of compression technology lead to a growing interest in video streaming as a tool in Web-based instruction. Web-based animation has been widely used by the computer industry to train engineers (e.g. Cisco Systems, 1998). Although animation as a teaching tool was also widely adopted in higher education for teaching various subjects such as physics (Harms, Krahn, & Kurz, 1998), biology (Nicholls & Merkel, 1996), and engineering (Mohler, 1999), most of them were delivered though other media such as compact disc (CD) rather than the Web. Web-based movies are fundamentally different from their CD-based counterparts. Since bandwidth is still a major concern, Web-based movies are usually compact in both screen size and length.
Since the introduction of PowerPoint (Microsoft Corp., 1999), computerized slide shows have been commonly used as a presentation tool. Because this medium was viewed as primarily an electronic page turner, it did not attract attention from educational researchers. Later, Macromedia Flash (Macromedia, 1999b) and Director/Shockwave added more animation and interactive features to Web-based slide shows. However, research in the medium is still sparse.
In this article, the efficacy of these two types of media was studied in the context of conceptual and procedural knowledge. It is hypothesized that the instructional effectiveness in terms of correct understanding is tied to the knowledge nature. Anderson (1983, 1990) asserted that there are two types of knowledge: declarative (conceptual) knowledge and procedural knowledge. Cognitive modes in learning these two types of knowledge are fundamentally different. It is hypothesized that linear movies can be effective in learning concepts while modularized slide shows are beneficial in learning procedures. The objective of this paper is to study the relationships between knowledge type and multimedia type instructional delivery. Conceptual and Procedural Knowledge
As mentioned before, users who construct their knowledge by exploring a simulation may end up missing important details and coming to wrong conclusions. To prevent this, a linear medium such as Quick Time movies or digital video imposes all information on the users. For example, the course introduced the notion that the median and the mode are equally robust in most situations and thus the median can be used in robust procedures. This concept may be taught by an interactive simulation, in which users can enter outliers to skew the distribution. However, the choice of outliers may affect the learnersą conclusion. Therefore, a more effective use of technology may be a linear, non-interactive movie showing how the median and the mode behave with pre-determined outliers. This leaves no room for users to miss or eliminate details. A textual explanation may have the same benefit of imposition. However, digital movies have two distinct features that cannot be found in text. First, linear movies using QuickTime can animate concepts that involve changes and complex relationships. Second, linear movies incorporate text, video, and audio. According to dual-code theory, learners have a higher retention rate of information while being exposed to multi-sensory stimuli (Ayserman, 1996).
This instructional strategy may not be effective in teaching procedural knowledge such as using statistical software to compute the power level and the sample size, to design an experiment by specifying factors and levels, and to examine the relationships of multiple variables. Because these tasks consist of several steps , showing all of them in a linear movie may be confusing and difficult to follow for a novice. Therefore, the course adopted both JavaScript-based and Shockwave slide shows as the medium for procedure demonstrations. The advantage of slide shows is that each step of the procedure is clearly identified and presented in a single frame. The shortcoming is the lack of interactive features.
The central research questions of this project were: Research Question and Hypothesis
The hypothesis was formulated as: There is an interaction effect between the media type and the knowledge nature.
- Do learners have better test performance in learning statistical concepts by viewing linear movies than by viewing modularized slide shows?
- Do learners have better test performance in learning statistical procedures by viewing modularized slide shows than by viewing linear movies?
Method
Sample
The sampling method was a mixture of convenience and purposive sampling. The subjects of this project were thirty-six volunteers who were undergraduate and graduate students at a Southwestern university. Subjects who had experience in SamplePower (SPSS, Inc., 1999) and DataDesk (Data Description, Inc., 1999), which are statistical software packages used in the treatment and the evaluation, were excluded from the study. Because there were not enough volunteers in the class, recruitment of participants was extended to other classes.The sample size determination was based upon power analysis and meta-analysis. According to a meta-analysis of thirty-five hypermedia studies conducted by Liao (1998), the overall grand mean of weighted effect size is .48. Given that the effect size was .48, the alpha level was .05, and the power level was .77, the desired sample size for this study was 36.
Design
The experiment was a 2 X 2 factorial design. The first factor was knowledge type, which was composed of two levels: conceptual and procedural. The second factor was multimedia type, which consisted of linear digital movies and modularized slide shows--both were between-subject factors. The design was orthogonal because the group sizes were equal (n = 9). The dependent measure was knowledge of power and regression measured by performance tests.
Treatment
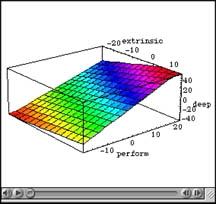
The treatment was two versions of multimedia: QuickTime movies and modularized slide shows. The topics presented in the treatment for both conceptual and procedural groups were about power analysis and regression. In the conceptual group, the emphasis was on the relationships among power, beta, alpha, effect size, and sample size, as well as the relationships among multiple variables in a regression model. In the procedural group, the focus was on using Sample Power to calculate sample size and DataDesk to diagnose a regression model.For conceptual learning, a QuickTime movie introduced the concepts of main effect and interaction effect by showing how a regression mesh surface changes due to a moderating variable (See Figure 1). The initial animation was rendered in Mathematica (Wolfram , S., 1994) and later imported into QuickTime.
Figure 1. QuickTime movie of regression
View the movie
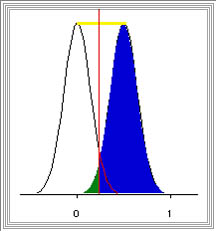
Another conceptual learning movie showed how the power and beta level varies due to the alteration of sample size, effect size, and alpha level (see Figure 2). The initial animation was created in Xlisp-Stat (Tierney, 1990).
Figure 2. QuickTime movie of power analysis
View the movie
For the procedural learning, the steps of plotting regression graphics in DataDesk and computing sample size in SamplePower were captured and imported into QuickTime movie (see Figure 3 and 4).
Figure 3. QuickTime movie of using DataDesk
View the movie
Figure 4. QuickTime movie of using SamplePower
The slide show version carried the same information‹the only difference being the media properties. In order to maximize the experimental variance (Kerlinger, 1986), features in these two media were polarized. Audio explanation was given in the movies while text-based explanation was used in slide shows. The primary visual element in the movies was animation although some still frames were inserted to give viewers sufficient time to digest the information. On the contrary, the primary visual effect in the slide shows was still graphics though minimal animation sparsely appeared. The movies were linear while the slide shows offered limited navigational options.
Instrument
The instrument for conceptual learning was a criterion-reference test. The test was composed of twelve multiple-choice questions. Content validity was established by two university statistical instructors. The gain scores between the pretest and the posttest were used as the dependent measure. The Cronbach Coefficient Alpha of the pretest was .80 and the Alpha of the posttest was .77. For the procedural group, the assessment was the posttest only because no subjects had prior experience in using the chosen software packages, thus a pretest was not necessary. The test consisted of two tasks, which required performing procedures in DataDesk and SamplePower. The evaluation criteria were based on the fulfillment of steps and the correct inferences from the completed tasks. The highest possible points were twelve. Another instrument was an open-ended survey to collect user feedback to the multimedia modules. User navigational patterns were also recorded by the raters.
Procedures
Students were randomly assigned to different groups. For the conceptual group, a pretest was given prior to instruction. Students were exposed to either a QuickTime movie or a modularized slide show. There was no time limit in viewing the tutorial; learners were allowed to replay the movie or the slide show as much as they wanted. A posttest was administered at the completion of the treatment. For the procedural group, students were also exposed to either a movie or a slide show. Again, there was no time constraint in the learning process. After the tutorial, participants were given two tasks that were resembled to the demonstration. Given a long period of time, students could find the procedure by trial and errors. Results from random guessing could not be regarded as learning. To prevent this from happening, students in the procedural group were allowed to spend no more than five minutes on each task.
Descriptive statistics were reported in Table 1. An ANOVA was conducted to detect the interaction effect. The assumptions of normality were checked by normality probability plots and the Shapiro-Wilk test (W = .96, p = .25). No significant departure from normality was detected in the dependent variable. The assumption of homogeneity of variance was also held by Leveneąs test (F(3, 32) = .26, p = .86). Results
ANOVA did not yield a significant result in the interaction effect (F(1, 32) = .19, p = .67), but yielded a significant result in both main effects. For the main effect of media type, F(1, 32) = 9.43, p = .00043 . For the main effect of knowledge , F(1, 32) = 17.99, p = .0002.
Effect sizes (Glass, 1976; Glass, McCraw, & Smith, 1981) were calculated to indicate the performance difference between the movie group and slide show group in conceptual learning and in procedural learning, respectively. The media effect size of procedural learning (1.14) was larger than that of the conceptual learning (.75).
Table 1 Descriptive Statistics of four groups
Movie Slide Show M SD M SD Conceptual 5.56
2.65
7.56
2.50
Procedural 2.00
1.58
4.67
2.34
The result did not support the hypothesis that an interaction of media type and knowledge nature would present. Nonetheless, valuable educational implications could be derived from the findings in main effects. For both conceptual and procedural learning, modularized slide shows were superior to movies. This result might be explained by the fastpace in the movies. Indeed, 50 percent of users in the movie group criticized that the movies were too fast to follow. Even though users were allowed to pause the movies and observe a still frame, only 44.4 percent of students used this feature. The performance gap between the conceptual group and the procedural group could be explained by the lack of concepts among users. Eighty percent of users in the procedural group complained that they could not perform the task because they didnąt understand the terms. For example, the task required students to compute the sample size for a 3X2 ANOVA. Although it was a two-factor design, 27.7 percent of users chose 3-factor design instead. Apparently, they confused the concepts of factors and levels i.e. they misperceived the three factors in "3X2" as three factors. This study revealed that the distinction between conceptual knowledge and procedural knowledge may be problematic. It is inconceivable that one could identify the problem and implement a proper procedure without conceptual understanding. A widespread misuse of statistical procedures is an example of how procedures are blindly followed without knowing their underlying assumptions and functions (Keselman et al., 1998). Discussion
This performance gap might be inherent in the knowledge nature. For example, it is easier to describe what object-oriented programming is, but it is more difficult to write a functional C++ or Java program. By the same token, telling what power and beta are may not be too challenging, but computing the actual power and sample size can be dificult. In order to evaluate "authentic" knowledge, several educational researchers promoted "portfolio-based assessment" (Wiggins, 1993; Wolf, 1995). In this light, conceptual and procedural learning might be better taught together as a coherent module.
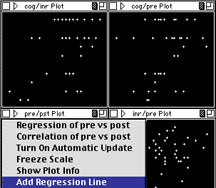
Although the slide show group was permitted to review the entire module, no students used the remote control panel in Shockwave slides or the "First" button in the JavaScript-based slide show to leap back to the first screen. Another interface puzzle was found not in the treatment, but in the evaluation. While being asked to draw a scatterplot matrix in DataDesk. 66.6 percent of participants were unable to choose the pull down menu entitled "plot" though it seemed to be obvious that graphing functions should be under "plot." (see Figure 5)
Figure 5. Plot menu in DataDesk Another interface problem was observed in SamplePower. In the dialog box where the effect size and the factor levels are entered, the button "register f/compute f" is colored. Despite that the colored button is obvious, half of the users who passed the first step did not know pressing the button to go forward (see Figure 6). The intuitive nature of graphical user interface might be an incorrect assumption.
Figure 6. SamplePower's interface
The use of streaming video via the Web is a fairly new instructional medium. Currently its instructional values are under-studied. This project served as an exploratory study to identify the issues and constraints of research in using this teaching tool. Although this study showed that QuickTime movies had benefits in neither conceptual nor procedural learning, its benefits might be inhibited by the problems in navigational interface. Further studies need to be conducted with an enhanced interface or with an explicit instruction of using the control panel. Since conceptual knowledge and procedural knowledge might be integral, future research should adopt a within-subject factorial design, in which learners could be exposed to both conceptual and procedural treatments. Conclusion
Apple, Inc. (1999). QuickTime 4. [On-line] Available: http://www.apple.com/quicktime/. References
Anderson, J. R. (1983). Cognitive psychology and its implications. San Francisco, CA: W. H. Freeman and Company.
Anderson, J. R. (1990). The Adaptive Character of Thought. Hillsdale, New Jersey: Lawrence Erlbaum Associates.
Ayersman, D. J. (1996). Reviewing the research on hypermedia-based learning. Journal of Research on Computing in Education, 28, 500-525.
Cisco Systems (1998). Cisco Networking Academy. [On-line] Avaialble URL: http://cnats.inre.asu.edu.
Data Description, Inc. (1999). DataDesk. [On-line] Available URL: http://www.datadesk.com/
Flanagan, D. (1998). JavaScript : the definitive guide. Sebastopol, CA : O'Reilly & Associates.
Glass, G. V. (1976). Primary, secondary, and meta-analysis of research. Educational Researcher, 5, 3-8.
Glass, G. V., McGraw, B., & Smith, M. L. (1981). Meta-analysis in social research. Beverly Hills: Sage Publications.
Goetzfried, L., & Hannafin, M. J. (1985). The effects of locus of CAI control strategies on the learning of mathematical rules. American Educational Research Journal, 22(2), 273-278.
Harms, U., & Krahn, H., & Kurz, G. (1998). Multimedia learning in the introductory physics course: The slice unitsą oscillatory motion. European Journal of Engineering Education, 23, 503-511.
Kerlinger, F. N. (1986). Foundations of behavioral research. New York: Holt, Rinehart and Winston.
Keselman, H. J., Huberty, C. J., Mix, L. M., Olejnik, S., Cribbie, R. A., Donahue, B., Kowalchuk, R. K., Lowman, L. L., Petoskey, M. D., & Keselman, J. C. (1998). Statistical practices of educational researchers: An analysis of their ANOVA, MANOVA, and ANCOVA analyses. Review of Educational Research, 68, 350-386.
Liao, Y. C. (1998). Effects of hypermedia versus traditional instruction on students' achievement: A meta-analysis. Journal of Research on Computing in Education, 30, 341-361.
Macromedia, Inc. (1999a). Flash 4. [On-line] Available: http://www.macromedia.com/software/flash/
Macromedia, Inc. (1999b). Macromedia Director. [On-line] Available: http://www.macromedia.com/software/director/
Microsoft Corp. (1999). Microsoft Office. [On-line] Available URL: http://www.microsoft.com/office/
Mohler, J. L. (1999). Improving the delivery of instructional graphics on the Web with vector technology. WebNet Journal, 1(3), 65-71.
Nicholls, C., & Merkel, S. (1996). The effect of computer animation on studentsą understanding of microbiology. Journal of Research on Computing in Education, 28, 359-372.
SPSS, Inc. (1999). SamplePower. [On-line] Available URL: http://www.spss.com/software/spower/
Steinberg, E. R. (1988). Cognition and learner control: A literature review, 1977-1988. Journal of Computer-Based Instruction, 16(4), 117-121.
Tierney, L. (1990). Lisp-Stat : An object-oriented environment for statistical computing and dynamic graphics. New York : Wiley.
Vygotsky, L.S. (1962). Thought and language. Cambridge, MA: MIT Press.
Vygotsky, L.S. (1978). Mind in society. Cambridge, MA: Harvard University Press.
West, R. W., & Ogden, R. T. (1998). Interactive demonstrations for statistics education on the World Wide Web. Journal of Statistics Education, 6, [On-line] Available URL: http://www.amstat.org/publications/jse/v6n3/west.html.
Wiggins, G. (1993). Assessment: authenticity, context and validity, Phi Delta Kappan, 75(3), 200-214.
Wolf, A. (1995). Competence-based Assessment. Buckingham, Open University Press.
Wolfram, S. (1999). The Mathematica Book. Cambridge: Cambridge Univ Prress.
Yu, C. H., & Behrens, J. T. (1995). Identification of misconceptions concerning statistical power with dynamic graphics as a remedial tool. Proceedings of 1994 American Statistical Association Convention. Alexandria, VA: ASA.
Yu, C. H., Anthony, S, & Behrens, J. T. (1995, April). Identification of misconceptions in learning central limit theorem and evaluation of computer-based instruction as a remedial tool. Paper presented at the Annual Meeting of American Educational Researcher Association, San Francisco, CA. (ERIC Document Reproduction Service No. ED 395 989).
|
 |